Authors: Zobash Noor, MD and Katelynn Davis, MD
Case Presentation
A man in his 70s with past medical history of coronary artery disease, hypertension, hyperlipidemia, and prostate adenocarcinoma, was seen by oncology after outpatient laboratory studies showed pancytopenia. He presented to his primary care physician for increased fatigue, decreased appetite, and shortness of breath. His CBC was notable for a WBC count of 1.9 X10E+09/L with marked neutropenia, hemoglobin of 8.5 g/dl and platelets of 18 X10E+09/L. His iron, folate, and Vitamin B12 levels were within normal limits. Serum LDH was 342U/l (reference range: 125-228 U/L) and haptoglobin was normal. CT chest/abdomen and pelvis was negative for lymphadenopathy, splenomegaly, or other evidence of malignancy. Serum immunofixation electrophoresis could not rule out a faint band in IgG kappa. Serum free kappa light chain was 35.4 mg/L (reference range: 3.3 to 19.4) and free lambda light chains was 26.5 mg/L (reference range: 5.7 to 26.3), with a free kappa to lambda ratio of 1.34 (reference range: 0.26 to 1.65).
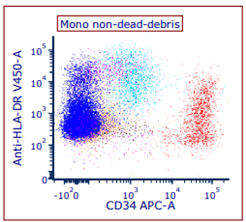
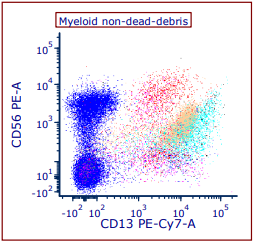
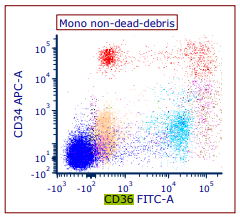
Peripheral blood flow cytometric immunophenotypic studies were performed and demonstrated approximately 4-6% myeloblasts with aberrant CD36 and CD56 expression and diminished CD13 and HLA-DR expression concerning for myeloid neoplasm.
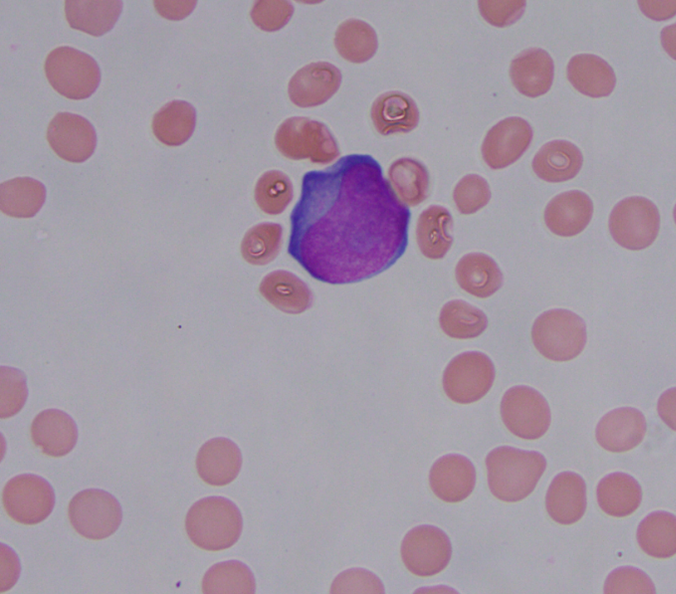
A bone marrow biopsy with aspirate was sent for evaluation. The peripheral blood was notable for 2% circulating blasts (Fig.1), absolute neutropenia, macrocytic anemia, and thrombocytopenia.
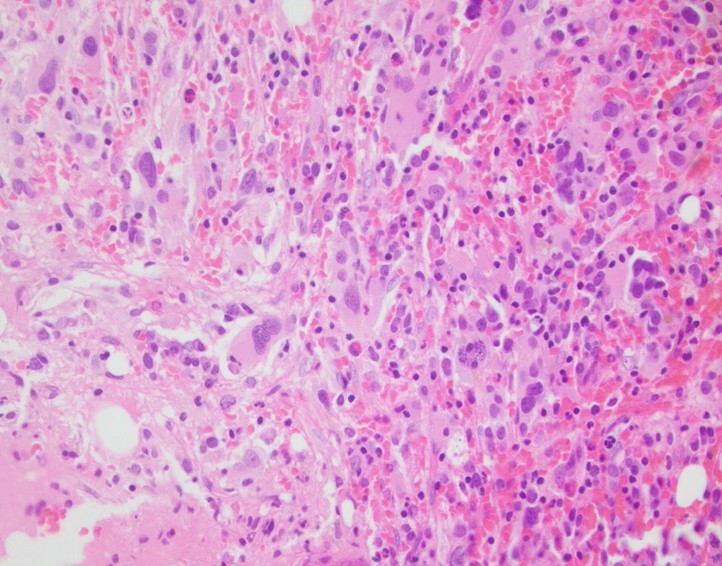
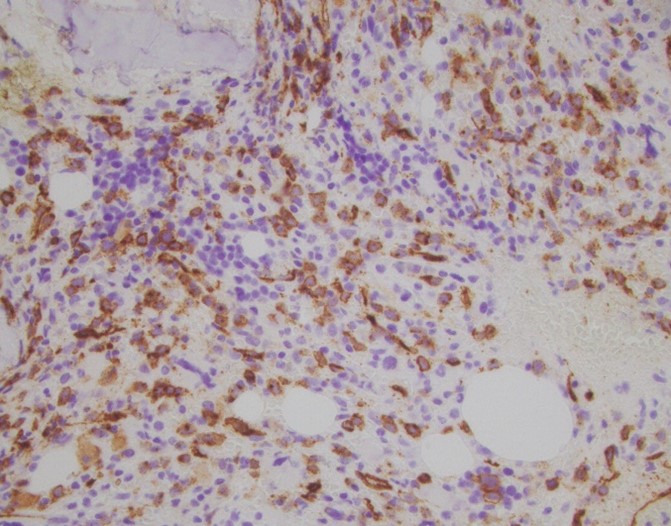
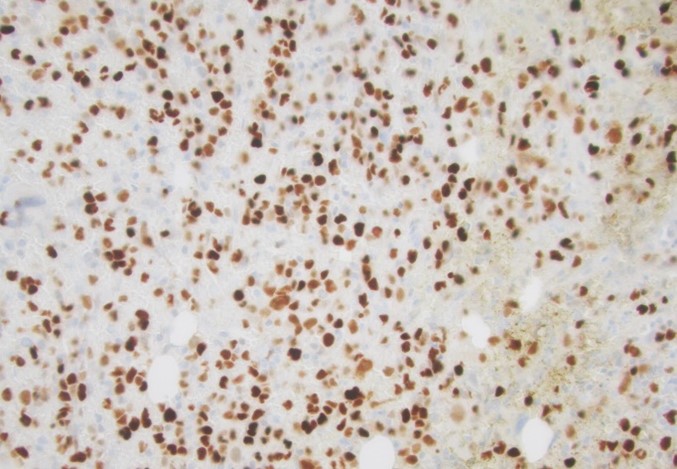
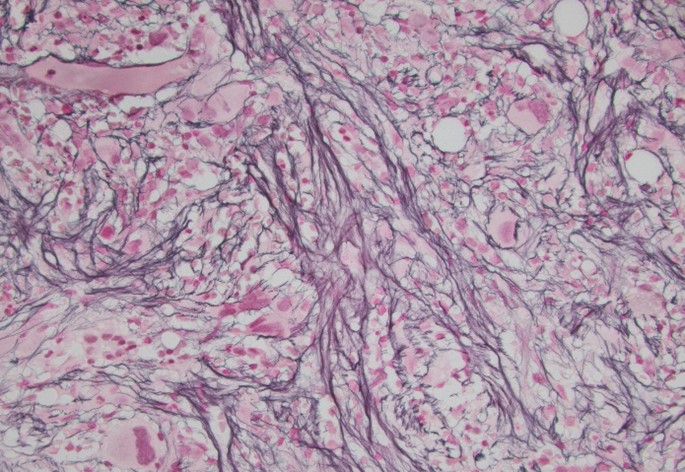
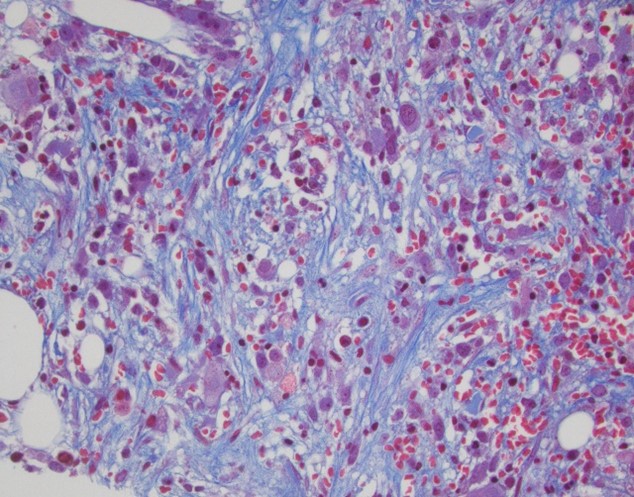
The bone marrow was hypercellular for age (approximately 80-90% cellular) with trilineage hematopoiesis and increased blasts that comprised ~20% of the cellularity on CD34 immunostain. Background trilineage hematopoiesis was present as well as increased diffuse reticulin and focal trichrome fibrosis on reticulin (Fig. 2D) and trichrome stains (MF 2-3) (Fig. 2E). Megakaryocytes were present in increased numbers and morphologically atypical with hyperchromatic forms and those with hypo lobated nuclei (Fig.2A). P53 stain (Fig. 2C) was strongly positive in a moderate number of cells raising a concern for TP53 mutation.
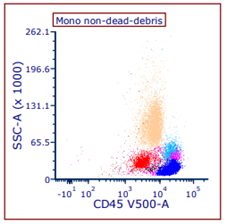
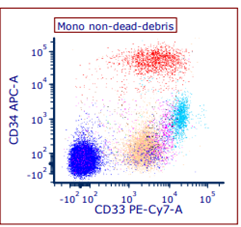
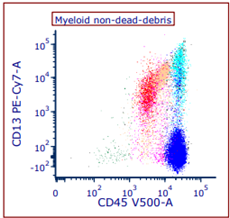
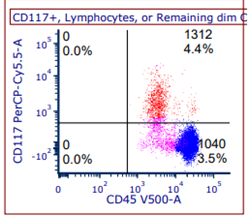
Flow cytometric studies (Fig. 3A to 3G) demonstrated an aberrant myeloid phenotype similar to the peripheral blood. Specifically, CD13, CD33, and CD117 support myeloid lineage. CD34 and HLA-DR support immaturity, and partial CD36 and CD56 are immunophenotypically aberrant (not seen in normal myeloblasts). Of note, cytoCD3, CD19, and myeloperoxidase (MPO) were all negative (ruling out other lineage-specific markers), and MPO is not required in acute myeloid leukemia. Overall, these findings were diagnostic of evolving acute myeloid leukemia that may have risen from a myeloid neoplasm (as evidenced by megakaryocytic atypia and fibrosis). Evolving terminology is used sometimes to illustrate the blast percentage just reaching the threshold of 20% for acute leukemia.
Myeloid NGS sequencing panel ordered on bone marrow revealed a TP53 mutation (allele frequency of 16%) and microarray analysis was notable for 5q deletion, 20q deletion, as well as additional abnormalities consistent with a complex karyotype (3 or more abnormalities).
Flow Cytometric Immunophenotypic Results on Bone Marrow (Blasts Shown in Red)