
Authors: Zachary High, MD and Erika Moore, MD
Date of Publication: December 1, 2025
Case Summary
The patient was a woman in her 80s. She had a past medical history of bilateral breast cancer (>20 years prior) status post lumpectomies, radiation therapy, and later, hormonal therapy for disease recurrence. Most recently, the patient began experiencing progressive fatigue for the past several weeks. Her hemoglobin labs revealed a new anemia of 7.8 g/dL (previously stable around 10.5 - 12.5 g/dL over the past several years). She was given 2 units of packed red blood cells and started on Aranesp (erythropoiesis stimulating agent).
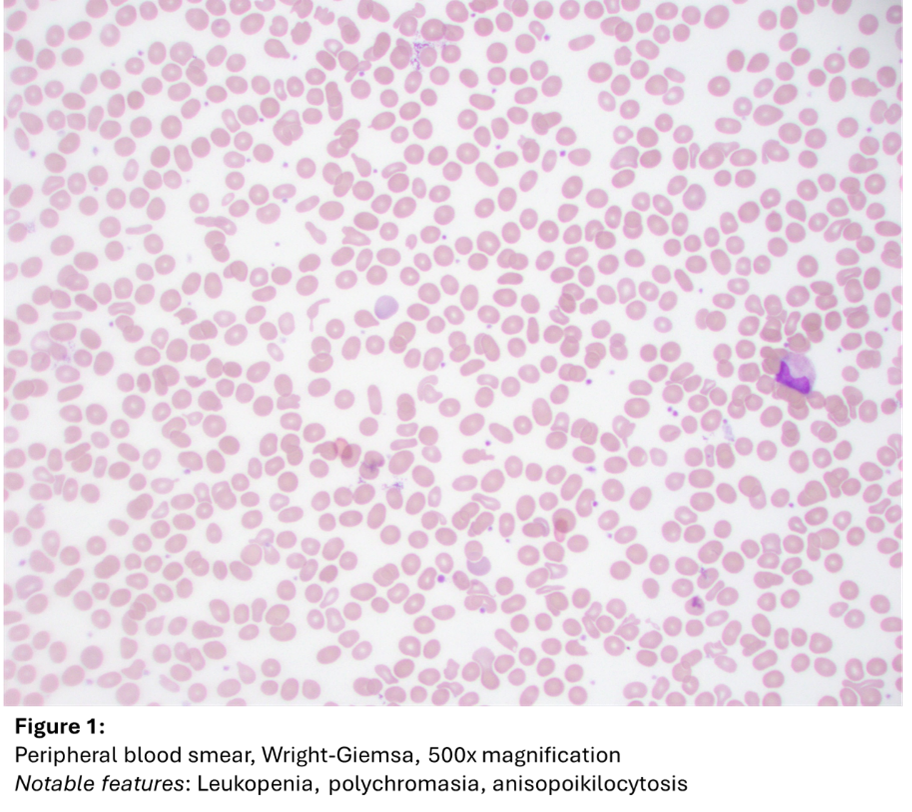
She underwent a bone marrow biopsy for further evaluation. At that time, her peripheral blood demonstrated leukopenia with absolute neutropenia (WBC 3.0 x 10⁹/L, ANC 1.32 x 10⁹/L), normocytic anemia (yet improved following therapy, now at Hgb 10.3 g/dL), anisopoikilocytosis, and polychromasia (Figure 1). No circulating blasts were observed.

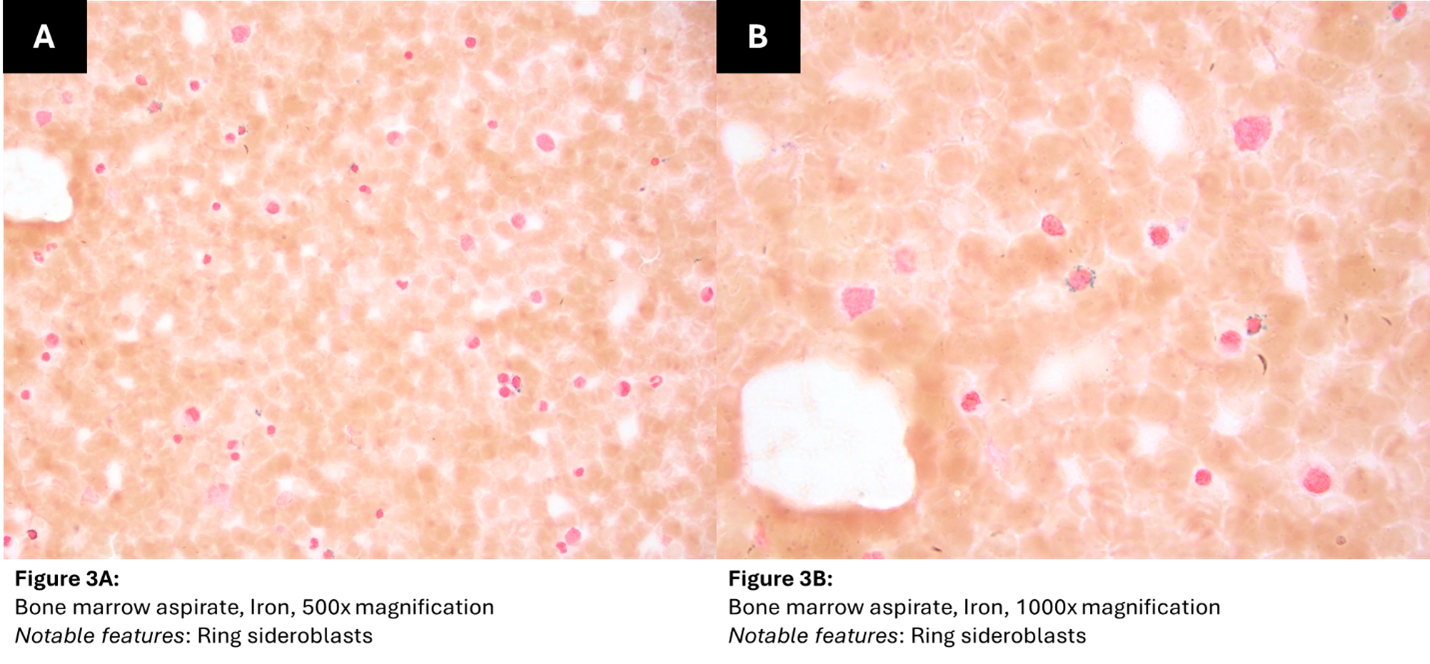
A bone marrow aspirate revealed dyserythropoiesis (nuclear budding, multinuclearity), rare megakaryocytic atypia (widely separated nuclei), and approximately 1.0% blasts on a 500-cell manual differential count (Figure 2). An iron stain of the aspirate demonstrated many ring sideroblasts (65% based on a 100 erythroid manual cell count of erythroid precursors) (Figure 3).
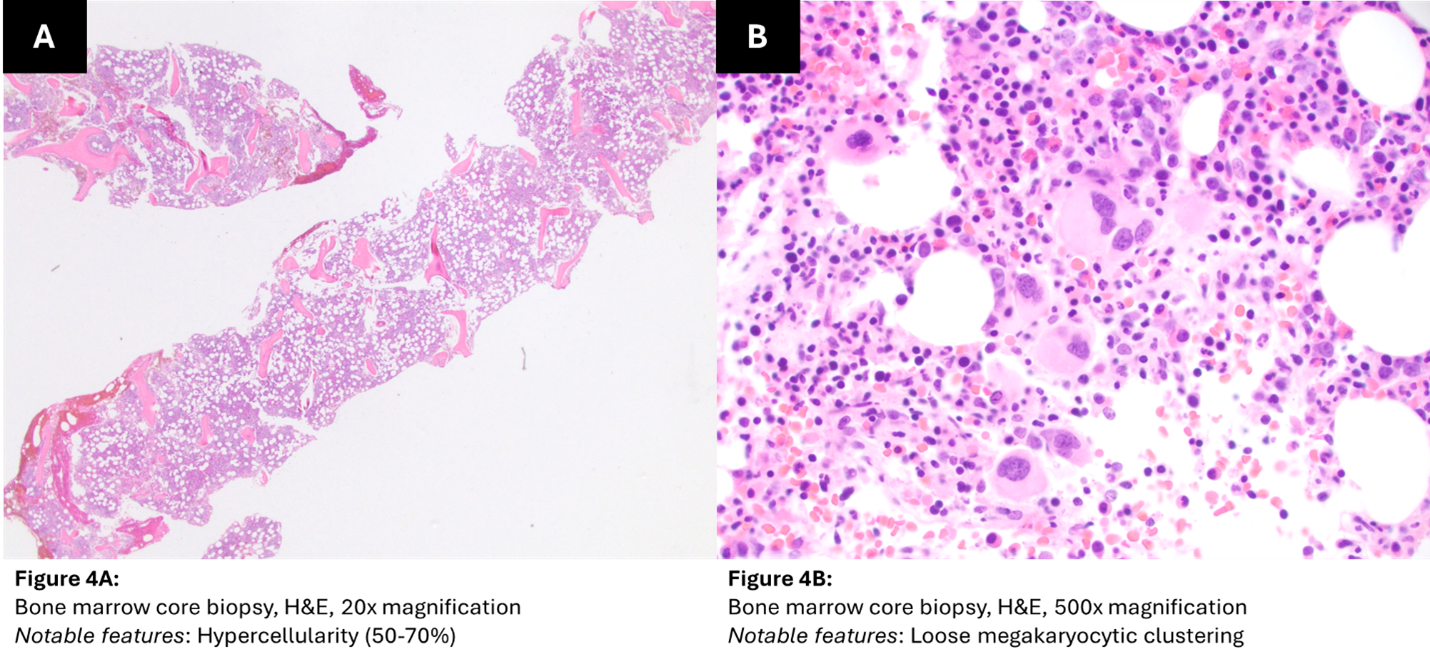

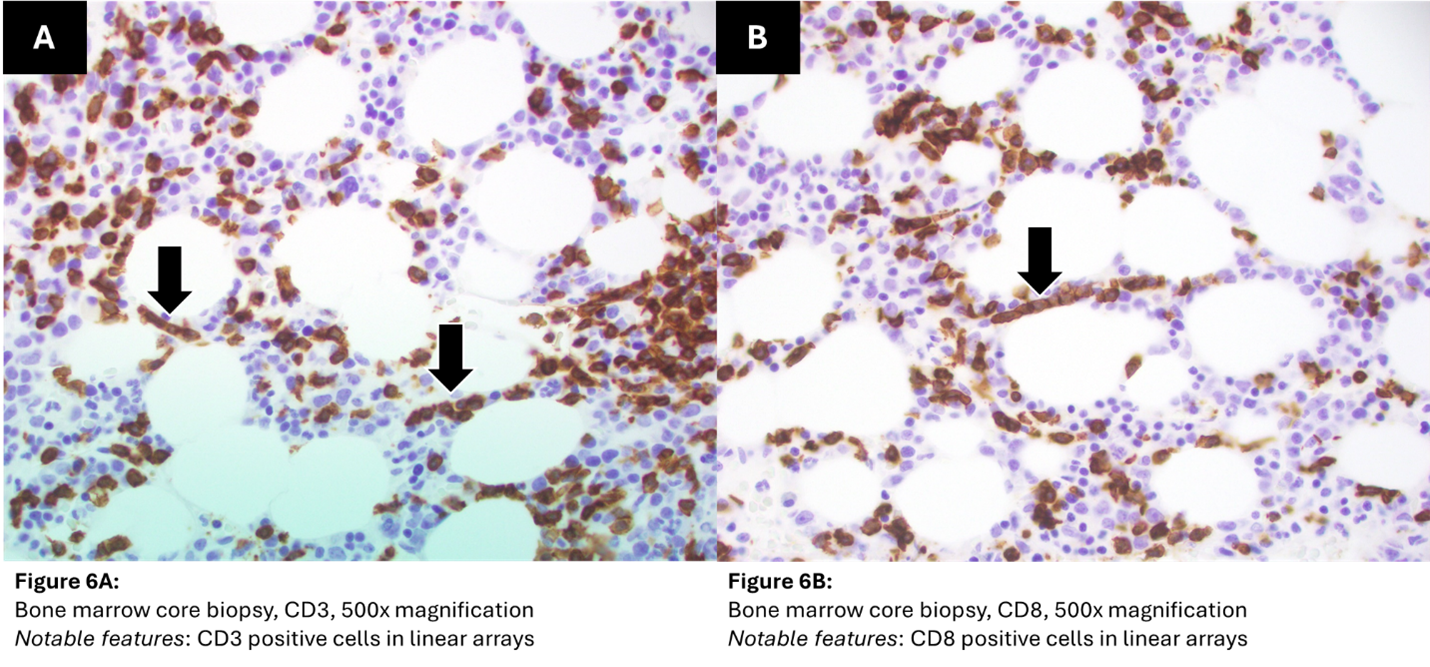
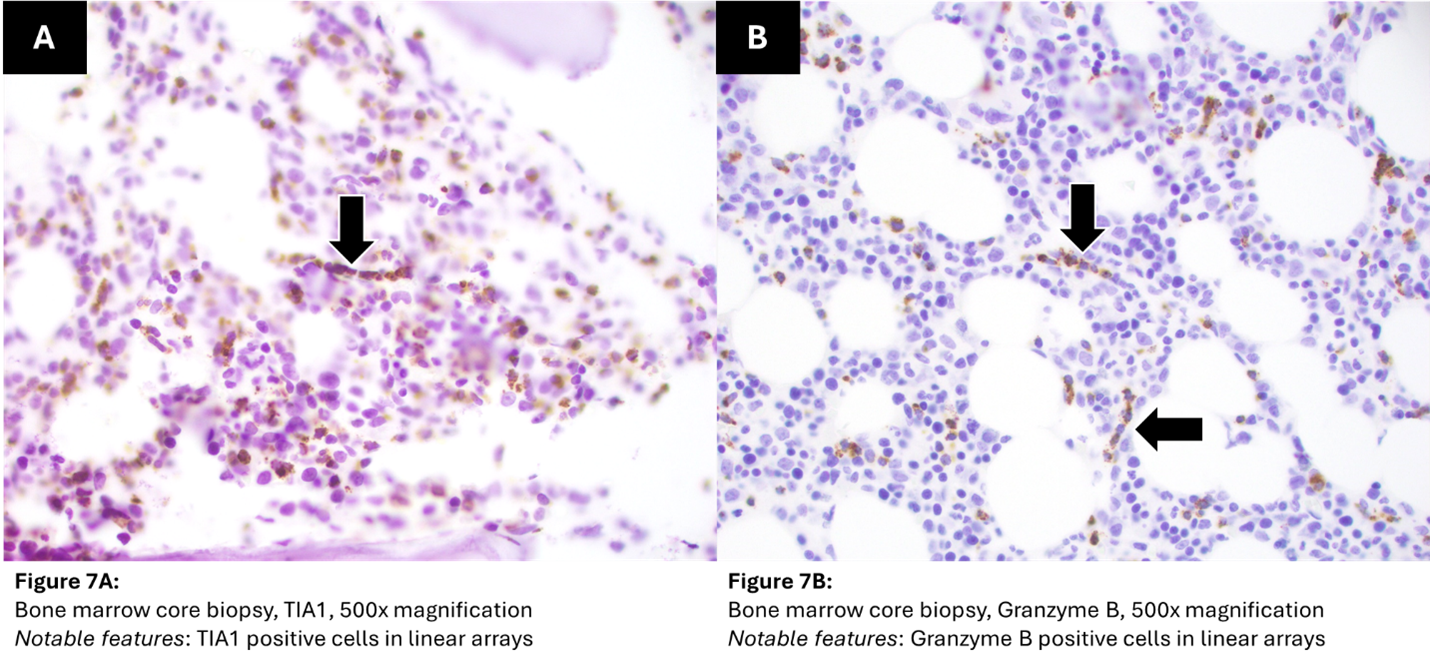
A bone marrow biopsy revealed hypercellular marrow (50-70%) with loose megakaryocytic clustering (Figure 4). On immunohistochemical evaluation, a moderate number of T-cells that were positive for CD3, CD8, TIA1, and Granzyme B were also occasionally arranged in linear arrays (intrasinusoidal pattern) (Figures 5-7). CD4 was negative (Figure 5). CD5 highlighted fewer T cells than CD3.
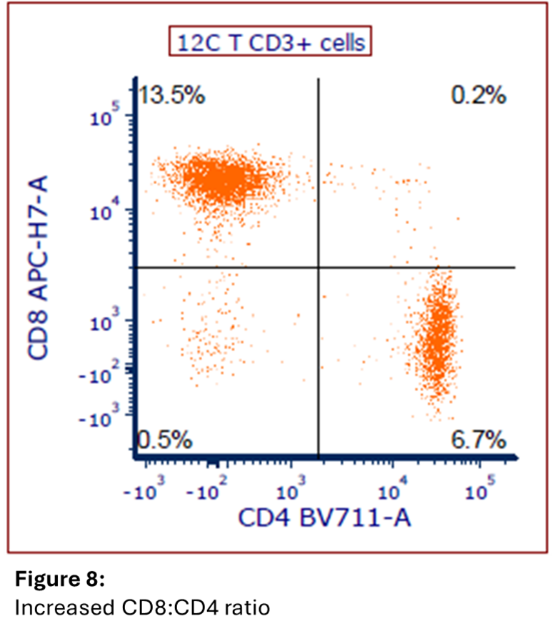
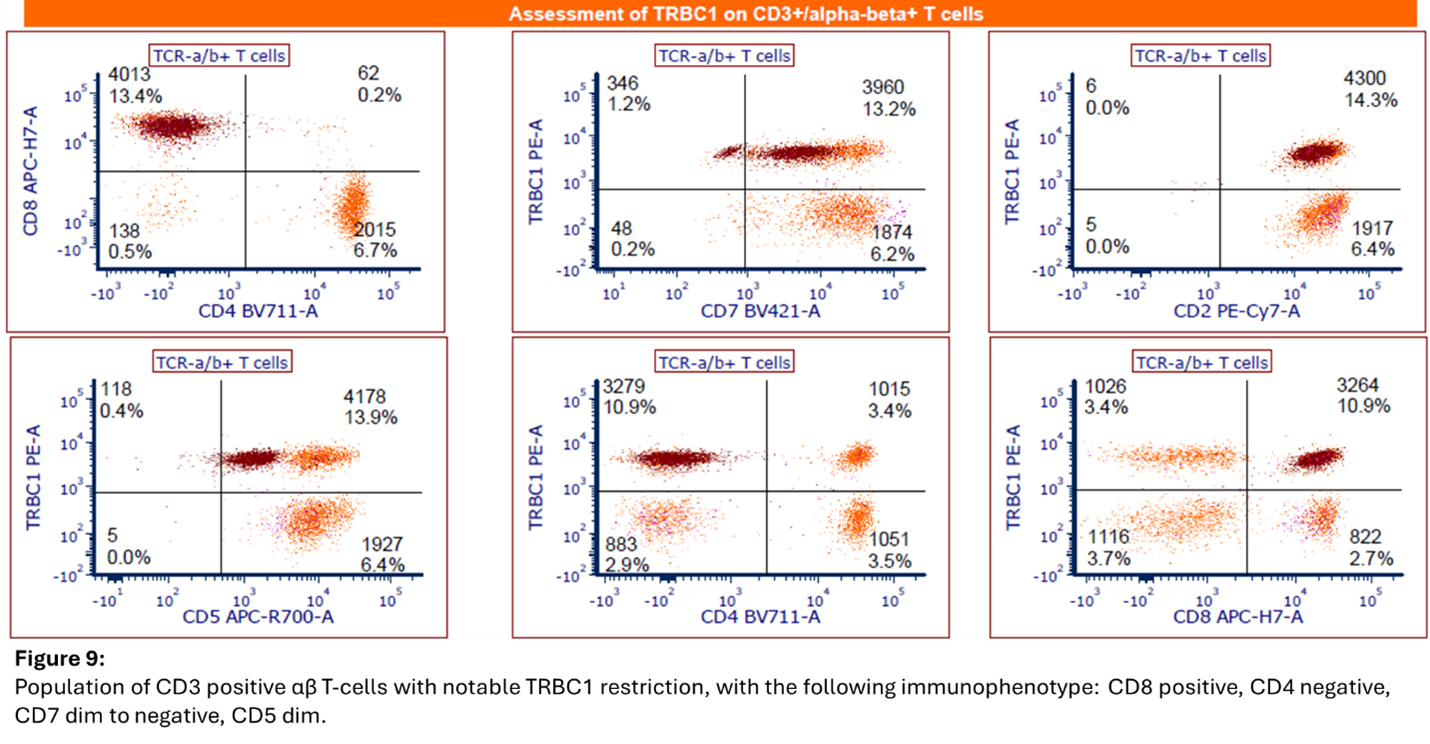
Flow cytometric studies of the bone marrow demonstrated an abnormal T-cell population comprising approximately 10% of total events and 48% of T cells with the following immunophenotype: CD3 positive, CD2 positive, CD5 dim, CD7 dim to negative, CD4 negative, CD8 positive, CD56 negative, CD16/57 positive, TCRαβ positive, TCRγδ negative, and TRBC1 restricted (positive) (Figures 8-9). Additionally present were approximately 0.2% CD34 positive myeloblasts, a moderate number of granulocytes, few CD14 positive monocytes, a moderate number of background heterogenous T cells, few natural killer cells, rare hematogones, and rare polytypic B cells.
Karyotype evaluation demonstrated trisomy 8 in fourteen of sixteen cells. Microarray analysis demonstrated trisomy 3 in 20% of cells and trisomy 8. Molecular studies demonstrated Tier 1 mutations in SF3B1 (p.K666N, VAF 25%) and STAT3 (p.Y640F, VAF 8%), as well as a Tier 2 mutation in PPM1D (p.W427*, VAF 27%).